At high heating rates of PF flame or in a blast
furnace tuyere the volatile yield is greater than that measured by
a proximate analysis. The "Q factor" is that ratio of the
expected high temperature yield compared to the proximate volatile
matter. There is very little data published on the higher
temperature volatile yield of Australian coals, the data of Wall
and others (1992), shown in the figure below, does indicate high Q
factors for high rank coals. The data from Ashman and others
(1999) and Haywood and others (1995) show similar trends to the
data of Wall and others, though the Q factors calculated from this
data for low volatile coals were not as great. CoalTech has
compared over 11 different methods for determining high temperature
volatile yield.

Lately there has been considerable literature on
the use of phenomenological coal models to predict
devolatilisation, volatile nitrogen release and char
formations. Generalised devolatilisation models (network
models) are based on chemical/physical descriptions of the
structure and processes of the coal particle as the particle heats
up and pyrolyses. The three main coal devolatilisation models that
include nitrogen release are:
-
- FG-DVC
[1] functional group-depolymerization vaporization cross-
linking
-
FLASHCHAIN [2]
- CPD
[3,4,5] chemical percolation- devolatilisation
The reported predictions of these
devolatilisation models are shown below.
Solomon and Fletcher reviewed the predictive
ability of these network models. Brewster and others (1995)
found that FG- DVC gave improved predictions of mass loss compared
to the usual two step model for coal devolatilisation. FLASHCHAIN
is being incorporated into EPRI’s software package Coal
Quality Impact Model to improve the NOx
predictions.
The CPD model differs from other network models
in that only one empirical parameter is used to fit the
devolatilisation of all coals, all other coal-dependent structural
coefficients are taken directly from 13C NMR
measurements. Recently, Perry (1999) expanded CPD model to
include nitrogen release as tar and light gases (CPD- NLG).
To extend the use of CPD to when 13C NMR
measurements were not available Genetti (1999) produced equations
of best fit to allow coal proximate and ultimate analysis to be
used to determine the NMR based inputs to the model.
Some work has been carried out by CoalTech to
evaluate the CPD-NLG model, this has been limited to evaluating 8
coals using the NMR inputs calculated based on Genetti’s
work. Reasonable agreement was found with Entrained flow reactor
data, but for wire- mesh data (higher temperatures) the CPD-NLG
model predicts a smaller increase in volatile yield than the actual
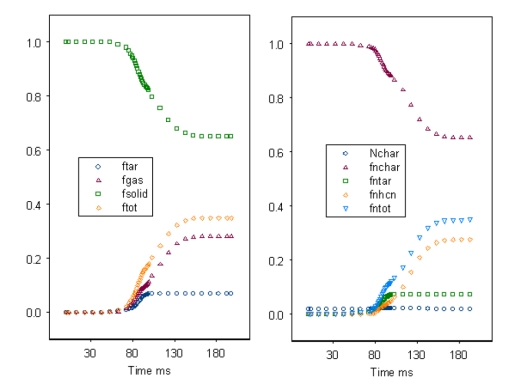
data. Typical yield curves for char (fchar), tar (ftar), light
gases (fgas) and total volatiles (ftot) with the fraction
conversion of nitrogen to the major species are given in Figure
below.
To ascertain the influence of peak temperature on
the CPD-NLG model predictions two final temperatures were used,
1500 C and 2000 C, with a heat up time of 300 ms. For a high
volatile coal, the volatile yield did not increase significantly (Q
factor of 1.01), the volatile nitrogen increased by about 5% and
the char nitrogen decreased by 5%. For a medium volatile coal (24 %
daf), the volatile yield only increased by 2% (Q factor of 1.45),
the volatile nitrogen increased also by 2% and the char nitrogen
decreased by 2%.
[1] Solomon P., et el 1993, Fuel 72:469.
[2] Niksa S., 1996, “Assess coal quality
impacts on your personal computer”, 1996 International AFRF
Symposium.
[3] Fletcher T., 1992, Energy & Fuels,
6:414.
[4] Fletcher T., 1999, “User’s manual
for the CPD Model”, Brigham Young University, , 1999.
[5] Fletcher T., Kerstein A.R., Pugmire R.J.,
Solum M., Grant D.M., 1999, “A chemical percolation model for
devolatilization : summary”, Brigham Young University, ,
1999.
[6] Jones J.M., Patterson P.M., Pourkashanian M.,
Williams A., Arenillas A., Rubiera F., Pis J.J., 1999b,
“Modelling NOx formation in coal particle combustion at high
temperature: an investigation of the devolatilisation kinetic
factors”, Fuel 78, 1999.
[7] Niksa S., Muzio L., Fang T., Hurt R., Sun J.,
Mehta A., Stalling J., 1999, “Assess coal quality impacts on
NOx and LOI with EPRI’s NOx-LOI predictor”, Coal
Quality Evaluation Tools, EPRI 1999.


